OBD2 scanners have revolutionized vehicle maintenance, transforming from a tool for professional mechanics to an indispensable gadget for car owners. These devices unlock a wealth of real-time information straight from your vehicle’s computer, enabling you to proactively monitor its health and diagnose issues swiftly. Among the most potent capabilities of an OBD2 scanner is its access to live data. But how to read live data on an OBD2 scanner effectively?
This comprehensive guide will delve into the intricacies of live data, explaining what it is, how to interpret it, and, crucially, how to use it to pinpoint and resolve common vehicle problems. Whether you’re a seasoned car enthusiast or a beginner taking charge of your car’s upkeep, understanding live data is a game-changer.
Decoding Live Data on Your OBD2 Scanner
Live data, in essence, is a continuous stream of real-time information transmitted from your vehicle’s sensors and control modules while the engine is running. Think of it as a live health report for your car, constantly updating with vital signs like engine speed (RPM), sensor readings from the oxygen sensors, and adjustments in fuel delivery.
This dynamic data stream offers a profound advantage over simply reading diagnostic trouble codes (DTCs). While DTCs alert you to problems, live data allows you to observe the conditions under which these issues occur, detect intermittent faults, and even identify potential problems before they trigger a code. The specific data points available will depend on your vehicle’s make, model, and the sophistication of your OBD2 scanner.
Essential Live Data Parameters and Their Meanings
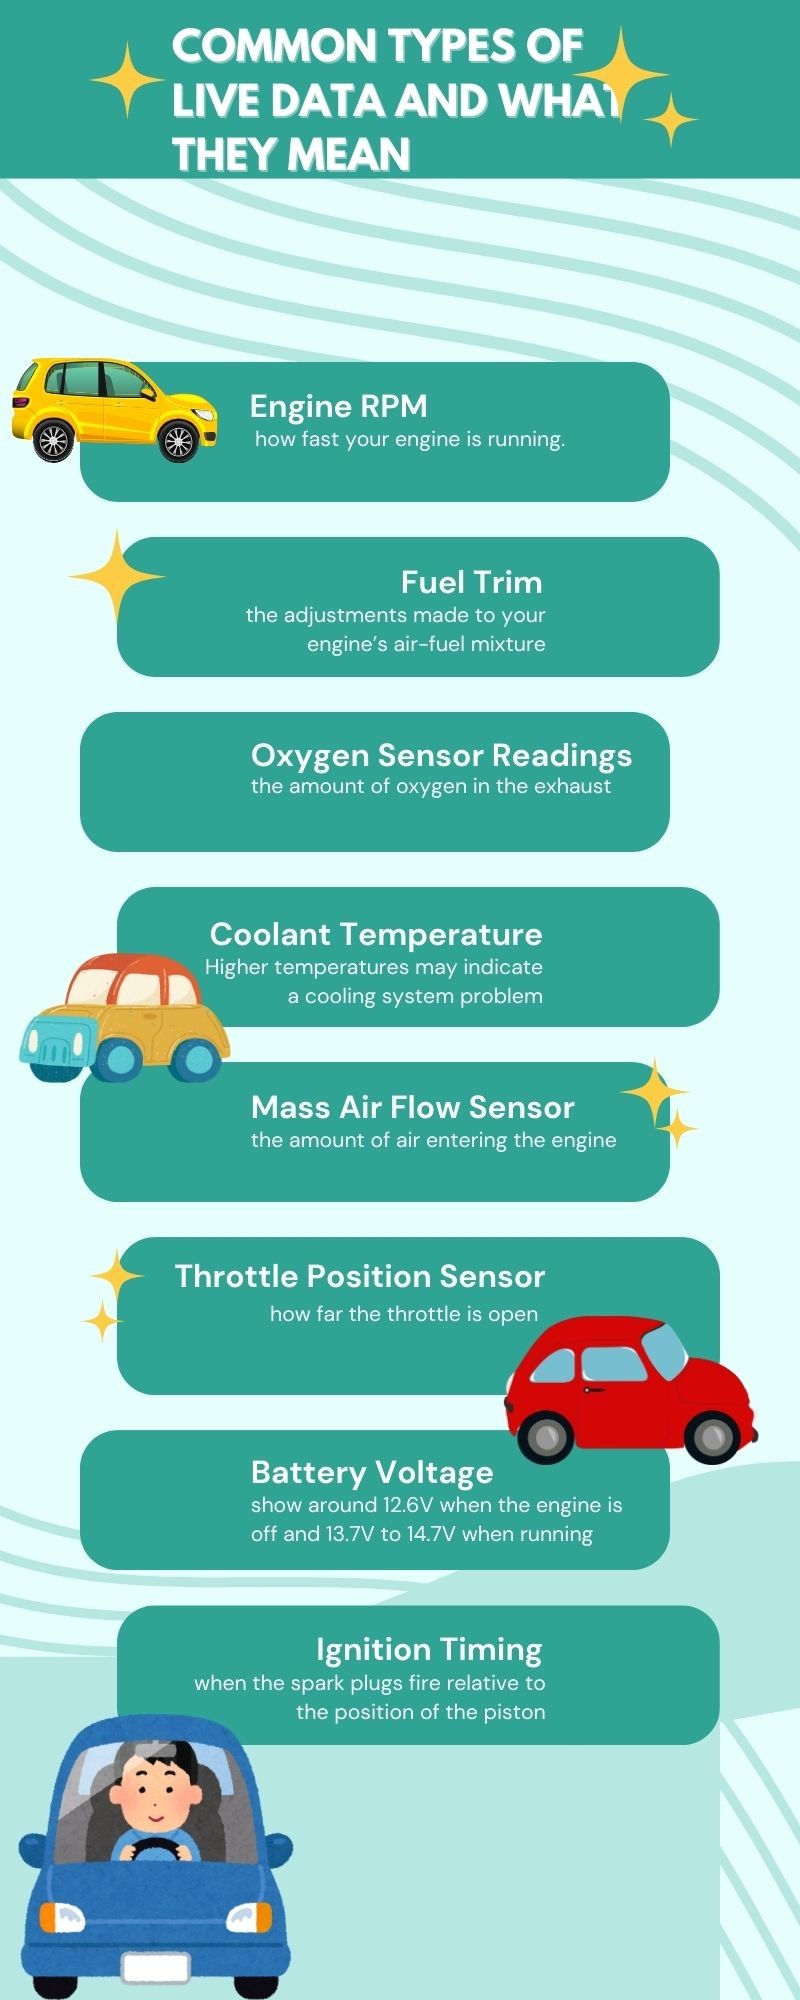 Common Types of Live Data and What They Mean infographic | Foxwell
Your OBD2 scanner will display a multitude of live data parameters, each providing a unique window into your vehicle’s operation. Here’s a breakdown of some of the most crucial data points and how to interpret them:
1. Engine RPM (Revolutions Per Minute):
- What it is: Measures how fast the engine’s crankshaft is rotating, indicating engine speed.
- Normal Range: Varies by vehicle and engine state (idle vs. driving). Typically, idle RPM is around 600-1000 RPM.
- Diagnostic Insights: Unusually high idle RPM could suggest issues with the idle air control valve, vacuum leaks, or throttle body problems. Low or erratic RPM can point to fuel delivery or ignition issues.
2. Fuel Trim (Short-Term and Long-Term):
- What it is: Represents the percentage adjustment the engine control unit (ECU) is making to the air-fuel mixture to maintain the ideal ratio. Short-term fuel trim (STFT) reacts quickly to immediate changes, while long-term fuel trim (LTFT) adapts over time.
- Normal Range: Ideally, fuel trim values should be close to 0%. Values within ±10% are generally considered acceptable.
- Diagnostic Insights: Positive fuel trim (e.g., +15%) indicates a lean condition (too much air, not enough fuel), possibly due to vacuum leaks, low fuel pressure, or a faulty MAF sensor. Negative fuel trim (e.g., -15%) suggests a rich condition (too much fuel, not enough air), potentially caused by faulty fuel injectors, high fuel pressure, or a restricted air filter.
3. Oxygen Sensor Readings (O2 Sensors):
- What it is: Measures the oxygen content in the exhaust gas, indicating the efficiency of the combustion process. Most vehicles have upstream (before catalytic converter) and downstream (after catalytic converter) O2 sensors.
- Normal Range: Upstream sensors should oscillate rapidly between rich (high voltage, around 0.8V) and lean (low voltage, around 0.2V) when the engine is warm and in closed-loop operation. Downstream sensors should show a more stable reading, indicating the catalytic converter is working.
- Diagnostic Insights: Slow or sluggish O2 sensor readings can indicate sensor degradation. Readings stuck high or low can point to sensor failure or fuel mixture problems. Comparing upstream and downstream sensor readings helps assess catalytic converter efficiency.
4. Coolant Temperature:
- What it is: Measures the temperature of the engine coolant.
- Normal Range: Typically between 190°F and 220°F (88°C to 104°C) once the engine is warmed up.
- Diagnostic Insights: Overheating (temperature above normal range) indicates cooling system problems such as a failing thermostat, water pump, radiator fan, or coolant leaks. Consistently low temperatures might suggest a stuck-open thermostat.
5. Mass Air Flow (MAF) Sensor Reading:
- What it is: Measures the amount of air entering the engine.
- Normal Range: Varies significantly with engine size and RPM. Scanners often display airflow in grams per second (g/s) or pounds per minute (lb/min).
- Diagnostic Insights: Low MAF readings can indicate a dirty or faulty MAF sensor, vacuum leaks after the MAF sensor, or a restricted air filter. Incorrect MAF readings can lead to poor fuel economy and performance issues.
6. Throttle Position Sensor (TPS):
- What it is: Indicates the position of the throttle plate, reflecting how much the throttle is open.
- Normal Range: Should read close to 0% at closed throttle and increase smoothly as the throttle pedal is pressed.
- Diagnostic Insights: Erratic or jumpy TPS readings can cause hesitation, stalling, or poor acceleration. A TPS reading stuck at a certain percentage might indicate a sensor malfunction.
7. Battery Voltage:
- What it is: Measures the voltage of the vehicle’s battery and charging system.
- Normal Range: Approximately 12.6V with the engine off and 13.7V to 14.7V when the engine is running (indicating the alternator is charging).
- Diagnostic Insights: Low battery voltage (below 12V engine off or below 13.5V engine running) can indicate a weak battery or alternator problems. High voltage (above 15V) might suggest a faulty voltage regulator.
8. Ignition Timing:
- What it is: Indicates when the spark plugs fire in relation to the piston’s position in the cylinder.
- Normal Range: Varies greatly depending on engine load and RPM.
- Diagnostic Insights: Incorrect ignition timing can cause engine knocking or pinging, reduced power, and poor fuel economy. Live data can help verify if the timing is advancing and retarding correctly under different conditions.
Step-by-Step Guide: How to Read Live Data on Your OBD2 Scanner
Now that you understand the key parameters, let’s outline the process of accessing and reading live data using your OBD2 scanner:
- Connect the OBD2 Scanner: Turn off your vehicle’s ignition and locate the OBD2 port, usually under the dashboard on the driver’s side. Plug in your OBD2 scanner securely.
- Turn Ignition to “ON” (Engine OFF): Turn the ignition key to the “ON” position without starting the engine. This powers up the vehicle’s systems and the OBD2 scanner.
- Navigate to Live Data/Data Stream: Power on your OBD2 scanner and navigate through its menu. Look for options like “Live Data,” “Data Stream,” “Real-Time Data,” or similar terms. The exact menu names will vary by scanner brand and model.
- Select Parameters to Monitor: Your scanner will likely present a list of available parameters. You can choose to view all parameters or select specific ones relevant to your diagnostic needs. Start with key parameters like RPM, coolant temperature, fuel trim, and oxygen sensor readings.
- Start the Engine (If Necessary): For many diagnostics, you’ll need the engine running to observe live data under operating conditions. Start your engine and allow it to reach operating temperature.
- Observe and Record Data: Watch the live data stream on your scanner’s display. Note down the values, especially if you suspect a problem. Many scanners allow you to record data for later review.
- Analyze Data in Context: Don’t just look at isolated readings. Observe patterns and how parameters change as you rev the engine, accelerate, or let the car idle. Compare readings to expected values for your vehicle (refer to your car’s repair manual or reliable online resources).
- Use Freeze Frame Data: If a DTC is present, utilize the “Freeze Frame” function. This captures a snapshot of live data at the moment the DTC was triggered, offering valuable context for diagnosing the issue.
 Car Scanner Test |Foxwell
Diagnosing Common Vehicle Issues Using Live Data
Live data is invaluable for diagnosing a wide range of vehicle problems. Here are practical examples of how to use it effectively:
- Check Engine Light Diagnostics: When the check engine light illuminates, read the DTCs first. Then, use live data to verify the fault. For example, a P0171 code (System Too Lean) can be confirmed by observing high positive fuel trim values and potentially lean oxygen sensor readings in the live data stream.
- Intermittent Misfires or Hesitation: If you experience occasional misfires or engine hesitation, monitor live data while driving. Watch for erratic RPM, fluctuations in MAF sensor readings, or changes in ignition timing that coincide with the misfire events.
- Poor Fuel Economy: Investigate drops in fuel efficiency by examining live data parameters related to fuel and air intake. High MAF readings at idle (indicating a vacuum leak), consistently rich fuel trim values, or malfunctioning oxygen sensors can all contribute to poor MPG.
- Engine Overheating: Monitor coolant temperature in live data. If it spikes rapidly or exceeds the normal operating range, it confirms an overheating issue. Further live data analysis can help pinpoint the cause, such as observing radiator fan operation or thermostat behavior.
- Battery and Charging System Problems: Check battery voltage in live data, both with the engine off and running. Low voltage readings point to battery or alternator issues, while excessively high voltage can indicate a voltage regulator problem.
Tips for Mastering Live Data Analysis
- Know Your Vehicle’s Baseline: Familiarize yourself with the typical live data readings for your vehicle when it’s running correctly. This provides a reference point for identifying deviations.
- Focus on Patterns and Trends: Don’t get fixated on single readings. Look for patterns, trends, and correlations between different parameters over time.
- Use Freeze Frame Data Wisely: Always utilize freeze frame data when available, as it captures crucial information at the moment a fault occurred.
- Consult Repair Information: Supplement live data analysis with vehicle-specific repair information, wiring diagrams, and technical service bulletins for a more comprehensive diagnostic approach.
- Practice and Experiment: The more you use live data, the better you’ll become at interpreting it. Practice using your OBD2 scanner and experimenting with different parameters to enhance your diagnostic skills.
Conclusion
Understanding how to read live data on an OBD2 scanner empowers you to take a proactive and informed approach to vehicle maintenance and repair. By learning to interpret these real-time signals from your car’s engine and systems, you gain a significant advantage in diagnosing issues accurately, saving time and money on repairs, and ensuring your vehicle operates at peak performance and efficiency. Mastering live data analysis transforms your OBD2 scanner from a code reader into a powerful diagnostic ally, putting you firmly in control of your car’s health.
FAQs
Why would you view freeze frame data?
Freeze frame data captures a snapshot of your vehicle’s sensor readings the instant a diagnostic trouble code (DTC) is triggered. This context is critical for understanding the conditions that led to the fault, especially for intermittent problems that are hard to replicate.
Which operating mode of the OBD-II system shows current data?
OBD-II operating mode 1 is specifically designed to display current live data from vehicle sensors. This mode provides the real-time data stream essential for dynamic vehicle monitoring and diagnostics.
What type of codes are stored in a freeze frame?
Freeze frame data is typically stored when emission-related powertrain codes (P-codes) are set. These codes relate to critical engine and transmission systems that impact emissions and vehicle performance, making freeze frame data particularly valuable for diagnosing these types of issues.